Solana price loses 11% in a week, is $100 the next test?
Solana price has rebounded toward $108 after falling close to $100, but its position below daily trend resistance leaves the recovery facing an early test near $111.
Summary
- Solana price traded near $107.77 after recovering from an intraday low of $101.69.
- Daily Bollinger Band resistance stood at $116.43, with lower-band support near $106.
- CoinGlass showed the strongest nearby liquidation concentration around $111, above the latest price.
- Weekly support stood at $93.75, while analysts outlined different paths for the correction.
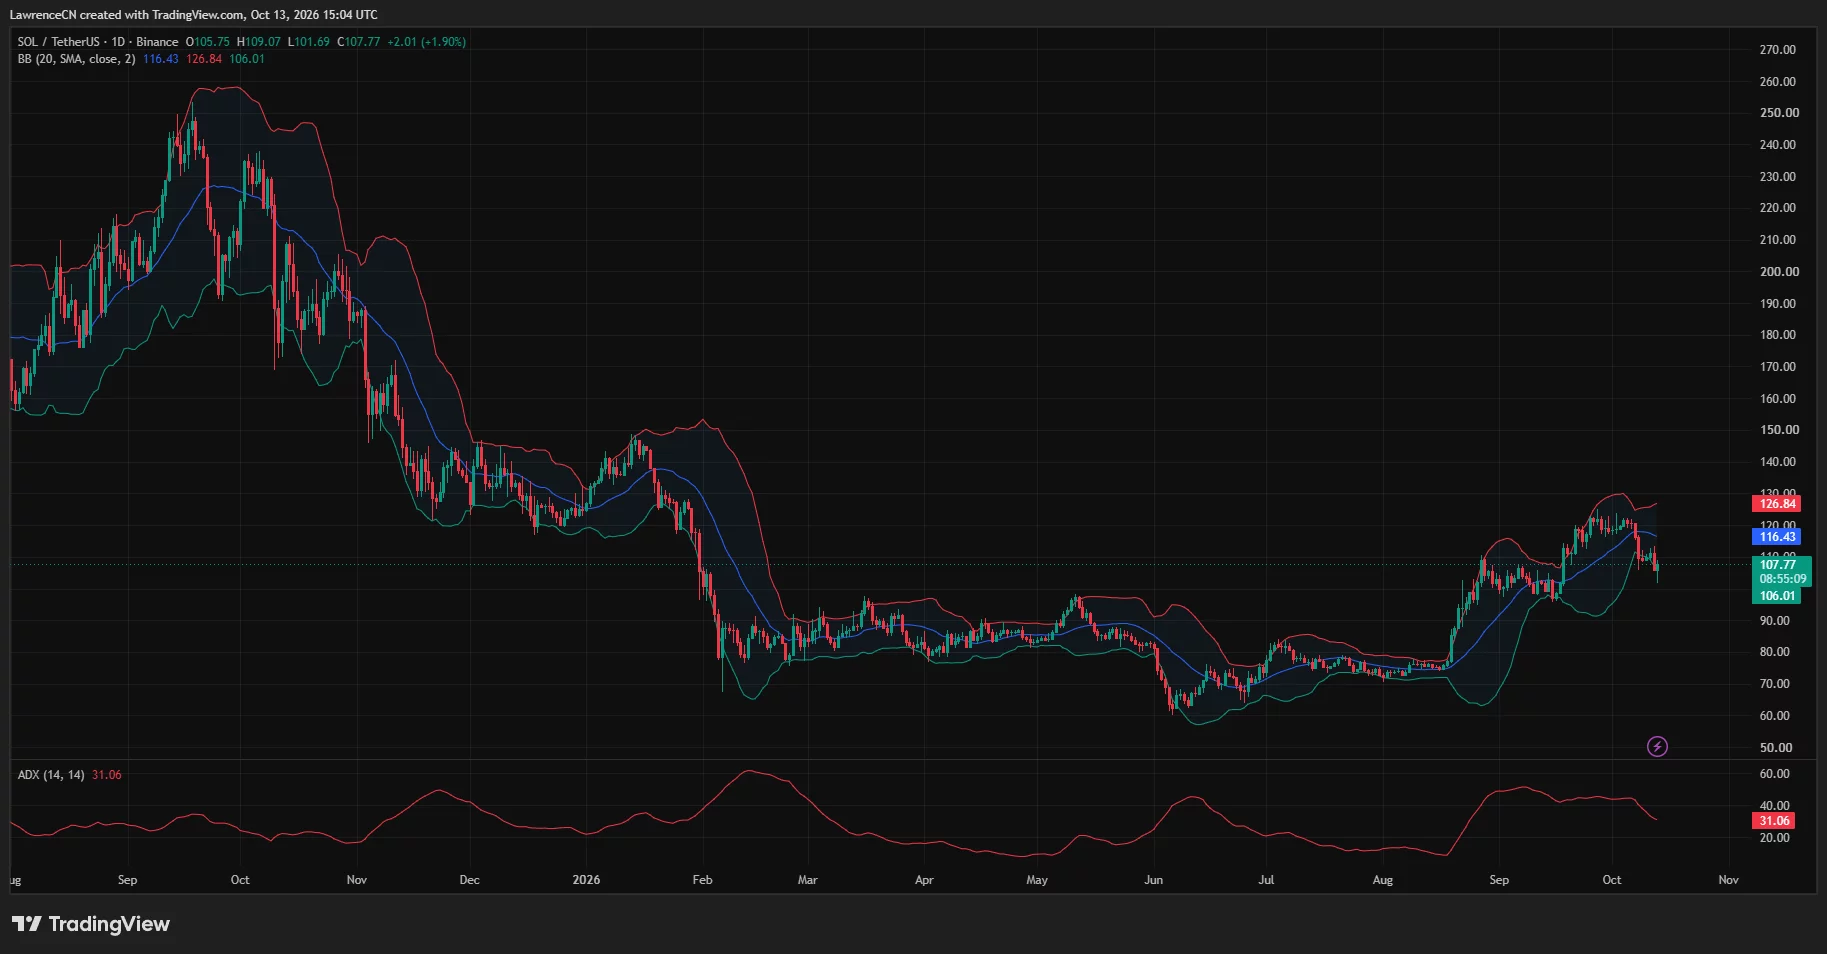
TradingView’s Binance SOL/USDT daily chart showed Solana trading at $107.77 on Oct. 13, up 1.90% during the session. The token had moved between $101.69 and $109.07, recovering roughly 6% from its intraday low while remaining below its early-October trading area near $120.
Compared with the Oct. 7 reference price of $120.65, the latest chart reading put SOL approximately 10.7% lower. The rebound reduced the weekly loss, but the daily chart still showed a sharp retreat from the recent highs and a price below its 20-day average.
Solana’s $106 band faces a fresh support test
TradingView’s daily Bollinger Bands placed the lower boundary at $106.01, the middle line at $116.43 and the upper boundary at $126.84.
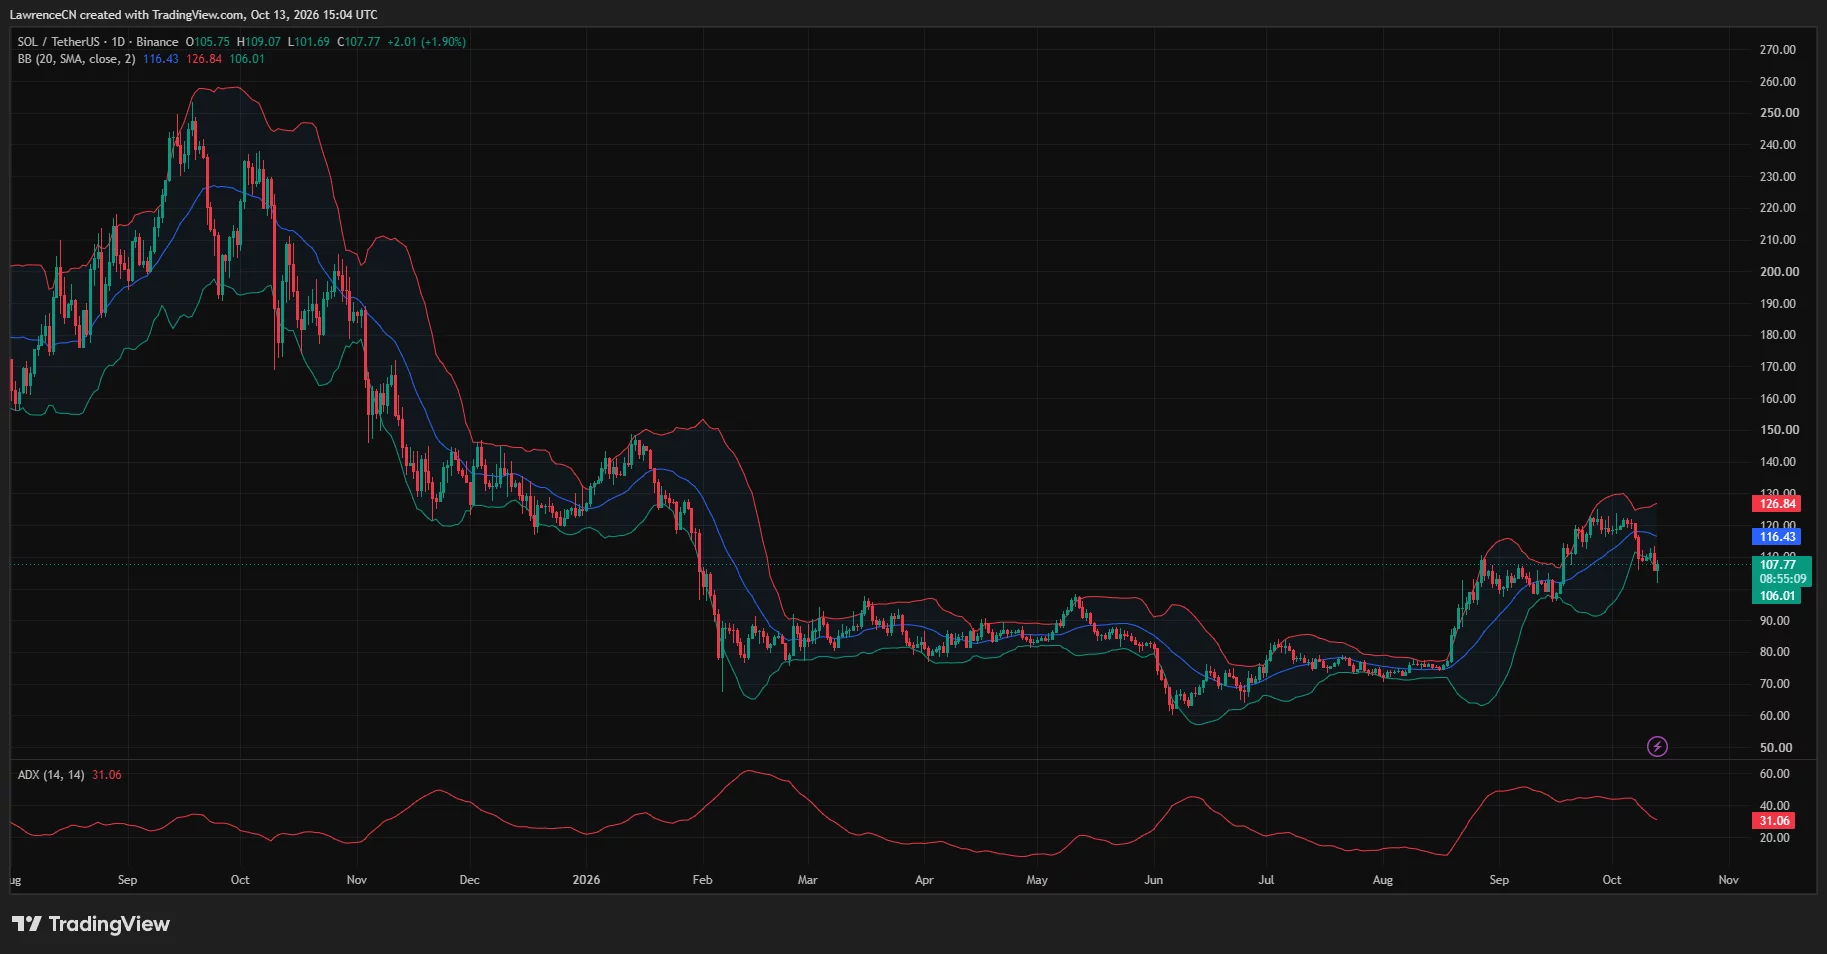
SOL had recovered above the lower band by the chart’s latest reading, following an intraday move beneath it. The rebound left $106 as the nearest visible band level below the market, followed by the session low at $101.69 and the psychological $100 threshold.
The daily chart showed that Solana’s recent advance had carried the token from its August trading area in the $70s toward $120. The latest correction pulled price back beneath the middle Bollinger line, reversing part of that advance without returning SOL to its earlier base.
At $107.77, the token remained about 8% below the $116.43 middle band. A recovery toward that line would therefore require SOL to move through the session high at $109.07 and the overhead liquidation concentrations visible on CoinGlass.
The daily average directional index stood at 31.06, down from higher readings during the preceding advance. The indicator measures trend strength rather than direction; alongside the falling price and declining reading, the chart showed a weakening of the earlier upward trend.
The daily setup places the first recovery test near $109, with the 20-day average farther above. On the downside, a renewed move beneath $106 would bring the recent low near $102 back into focus.
The $111 liquidation cluster sits above the rebound
CoinGlass’s three-day liquidation heatmap showed SOL falling from roughly $110, briefly rising above $113 and then dropping toward $102 before recovering toward $108.
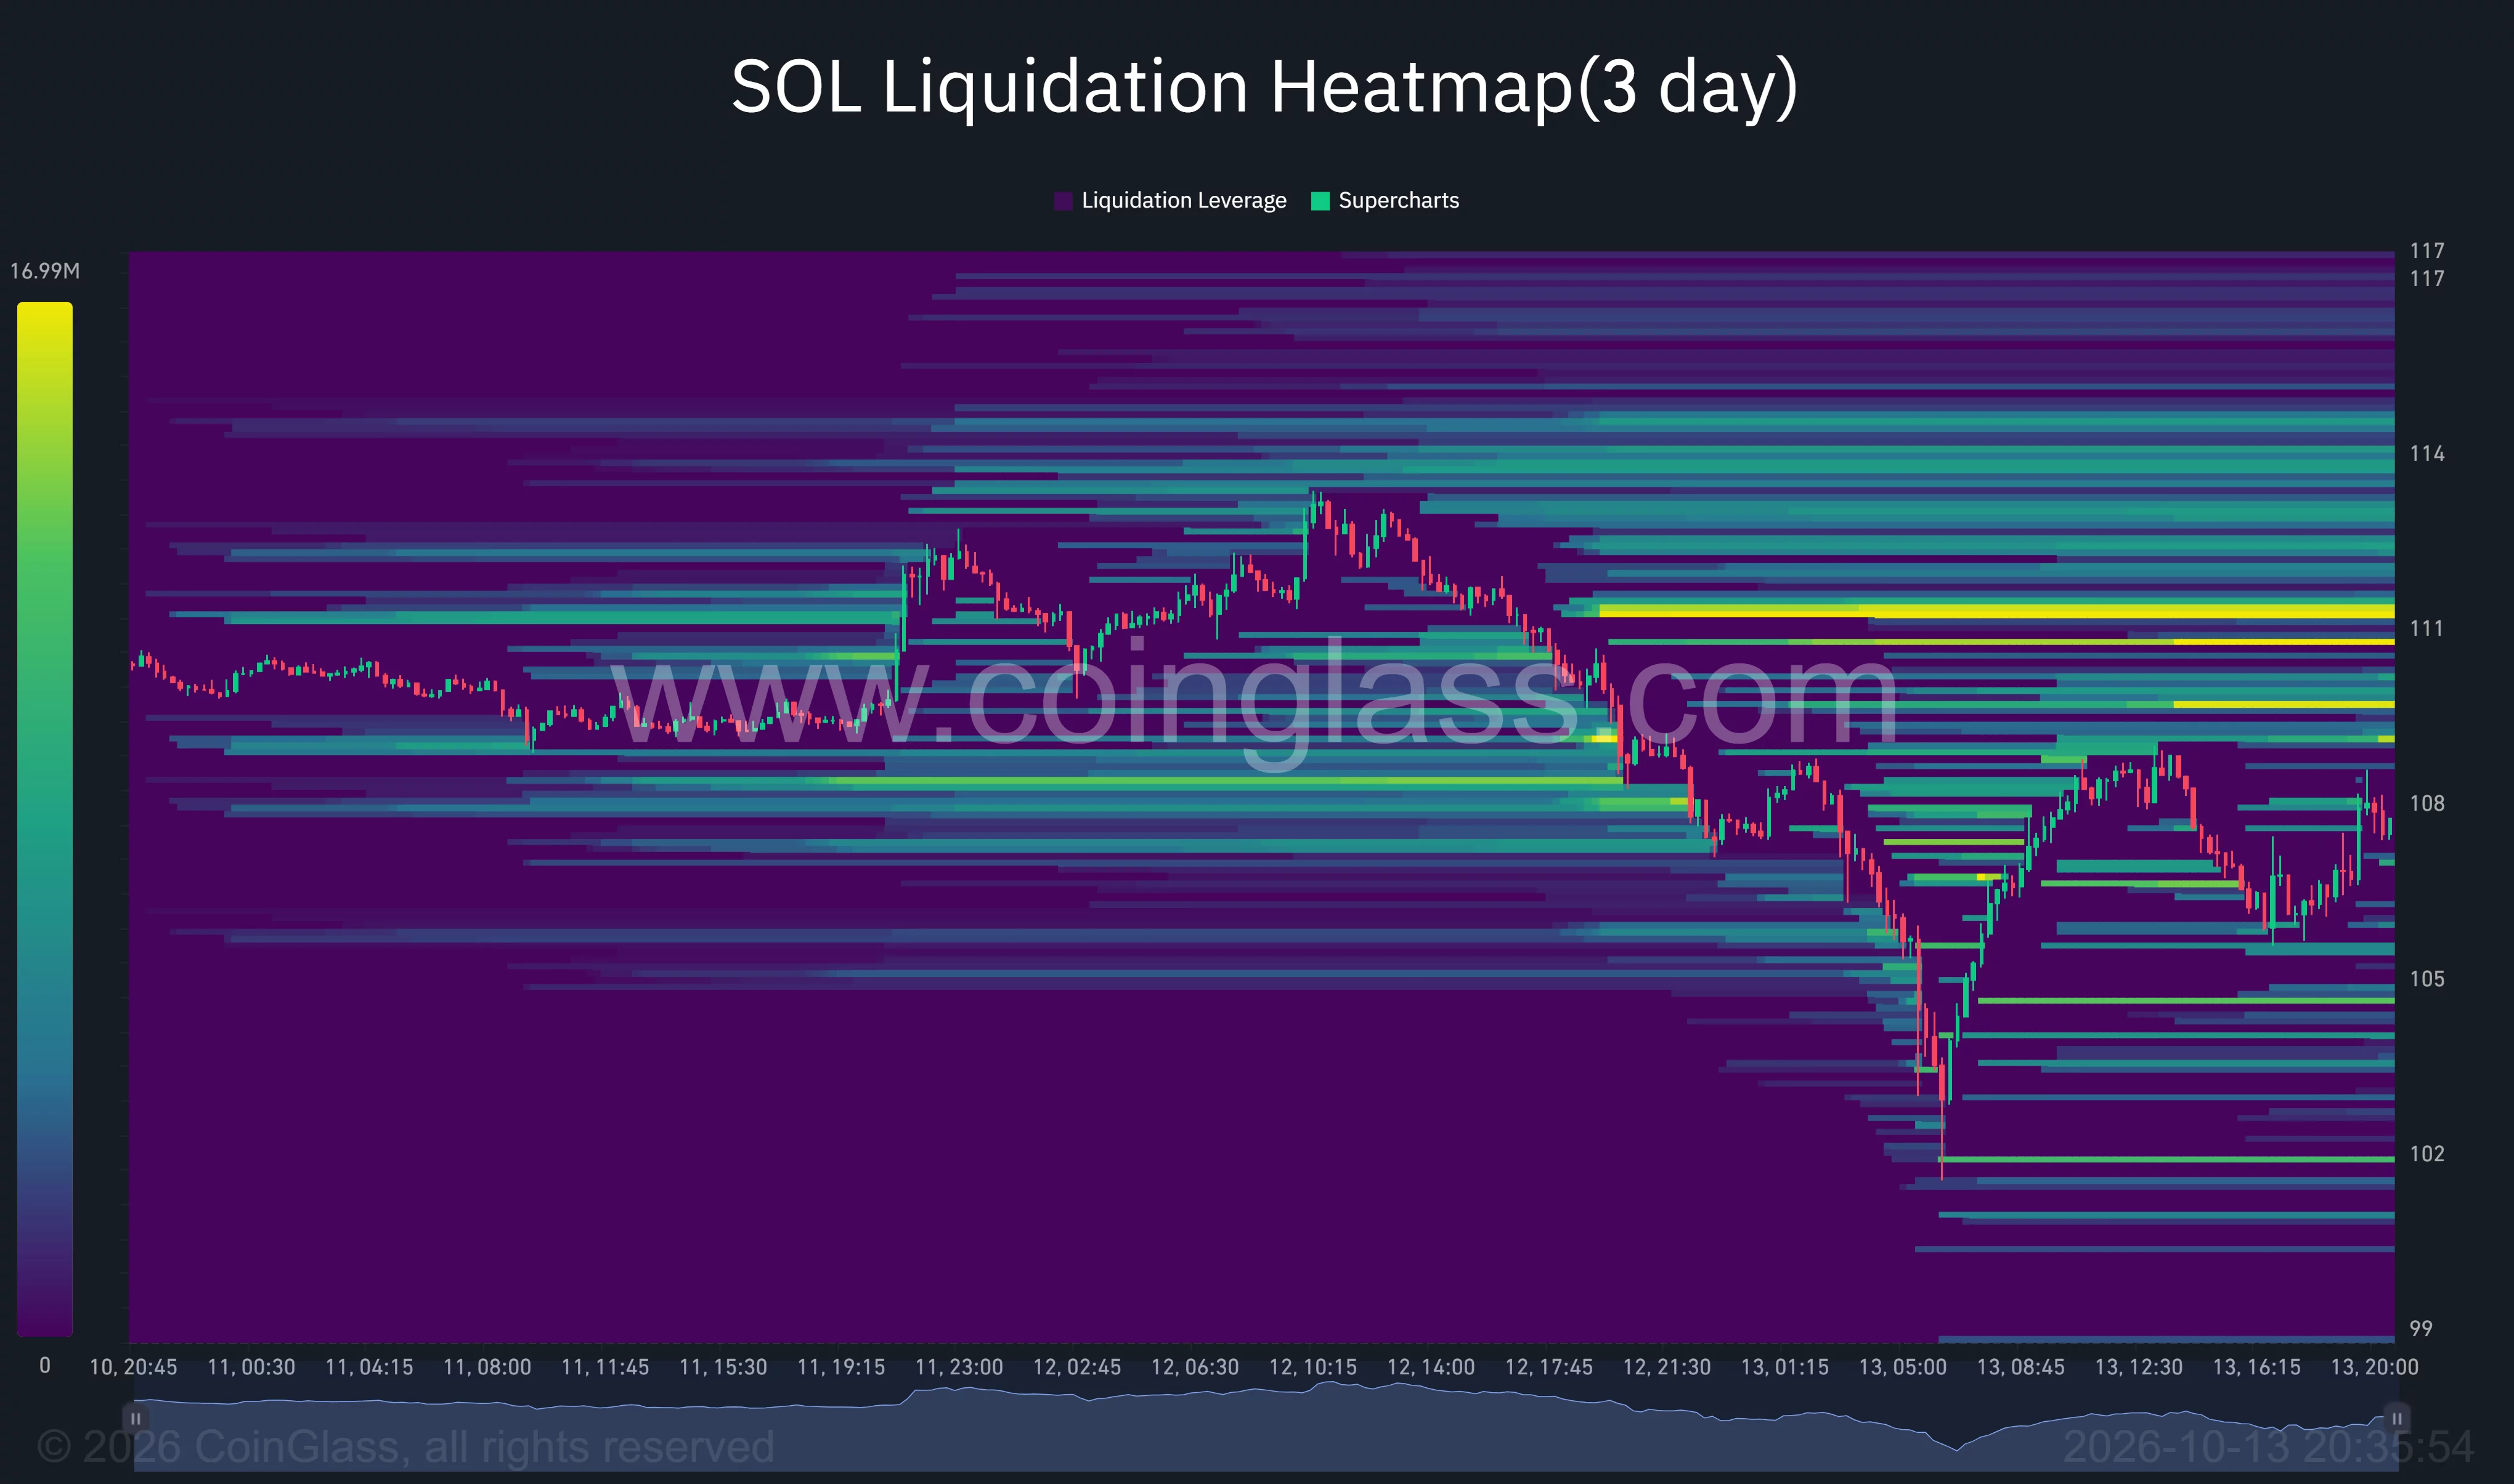
The brightest nearby concentration sat around $111–$111.5. Additional overhead bands appeared near $109 and across approximately $112–$114.50, placing several concentrations above the latest price.
Below the market, the heatmap showed bands around $106, $104, and $102. The lower concentrations lined up with areas crossed during the latest sell-off and rebound.
The price trace also showed that the first recovery from the low stalled below $109 before SOL retreated again. The latest bounce brought the token back toward $108, leaving the strongest overhead concentration unreached.
A move through $109 would put the $111 area next on the visible map. A retreat toward $106 would instead return SOL to the lower part of its recent trading range, with $104 and $102 beneath it.
CoinGlass’s heatmap maps estimated liquidation exposure rather than completed liquidations. Its bands identify potential pressure points for leveraged positions, while the price trace shows which areas SOL has already crossed.
Weekly support at $93.75 frames the deeper risk
TradingView’s weekly chart placed SOL at $107.76, down 3.22% from the week’s opening level of $111.35. The weekly range stretched from $101.69 to $113.40.
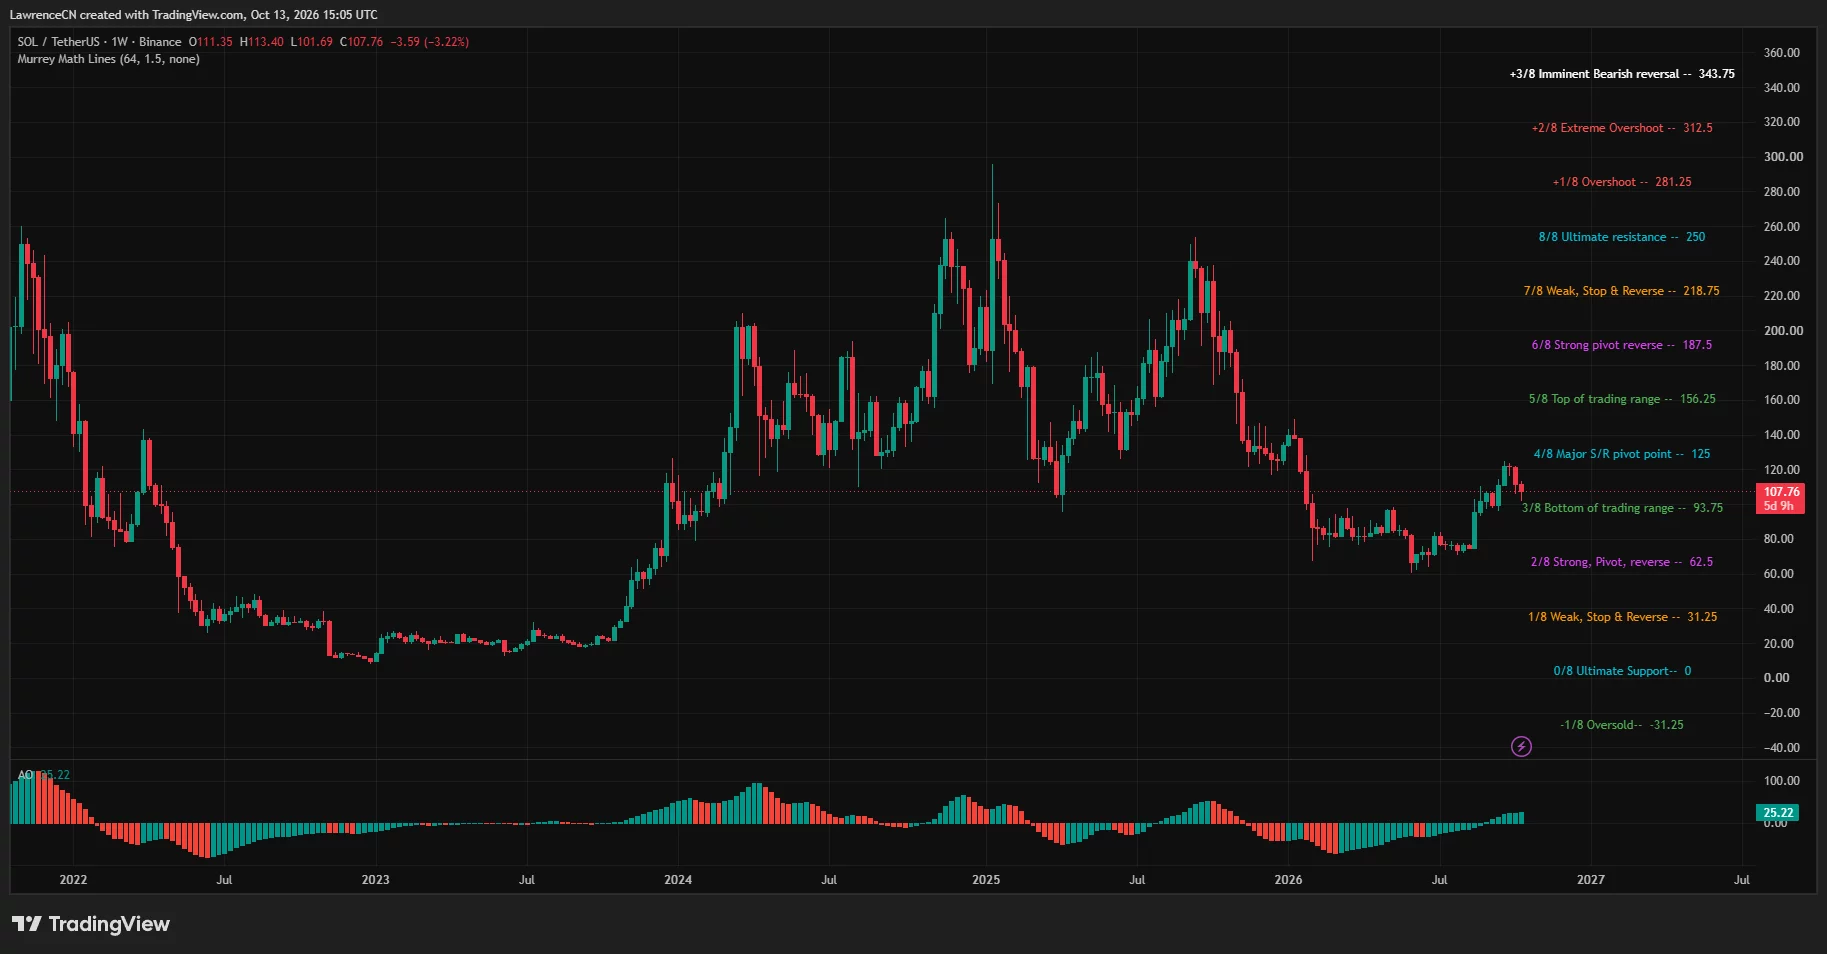
The Murrey Math indicator marked $125 as a major support and resistance pivot and $93.75 as the lower boundary of its displayed trading range. SOL remained between those levels after failing to sustain its recent advance toward $125.
At the latest reading, the $93.75 boundary sat approximately 13% below the market. A decline to that level would require SOL to lose both the recent $101.69 low and $100 along the way.
The weekly Awesome Oscillator remained positive at 25.22, with green bars. The longer-term momentum reading therefore remained above zero despite the latest weekly price decline.
Analyst Batman described SOL as returning to the lower boundary of an ascending channel. The analyst suggested another strong advance could follow if that structure held, citing a sharp expansion after an earlier channel.
CryptoBullet outlined a more cautious near-term path, saying SOL had reached the upper boundary of a target zone and could move deeper into it over the coming weeks. The analyst’s chart illustrated a further dip before a possible later recovery.
The two views make support retention central to the setup: Batman’s bullish scenario depends on the channel holding, while CryptoBullet anticipates additional weakness first.
US ETF withdrawals accompany the technical pullback
SoSoValue data showed that US spot Solana ETFs recorded $24.8 million in net outflows during the week ending Oct. 9. The withdrawals ended 14 consecutive weeks of inflows and marked the products’ largest weekly outflow since launch.
The US Bureau of Labor Statistics has scheduled the September consumer price index report for Oct. 14 at 8:30 a.m. Eastern Time, placing the inflation release immediately after SOL’s latest support test.
For SOL’s technical recovery, the immediate levels remain closer: $109.07 at the session high, the liquidation concentration near $111, and the daily middle band at $116.43. Below the market, $106.01 and $101.69 separate the latest rebound from another test of $100.
Disclosure: This article does not represent investment advice. The content and materials featured on this page are for educational purposes only.