Ethereum price slips under $1,800 but charts still point to $2,140 target
Ethereum has slipped below the key $1,800 level after renewed U.S.-Iran military escalation pushed oil prices higher and sent investors out of risk assets, although buyers continue to defend support near $1,750.
Summary
- Ethereum fell below $1,800 after renewed U.S.-Iran strikes pushed oil above $74 and sparked a risk-off move.
- Charts still support a possible rally toward $2,140 if ETH breaks resistance near $1,825-$1,850.
- Holding $1,750 remains critical, while a breakdown could expose support near $1,700 and $1,505.
According to data from crypto.news, Ethereum (ETH) price traded around $1,775 during Monday’s session, down roughly 3.6% from its daily high of $1,837 after fresh U.S. strikes on Iran reignited fears of a prolonged Middle East conflict.
Crude oil jumped about 4% to above $74 a barrel as Washington and Tehran exchanged missile strikes while tensions around the Strait of Hormuz intensified. The renewed geopolitical risk revived concerns that higher energy prices could keep inflation elevated, prompting traders to reduce exposure to cryptocurrencies alongside other high-beta assets.
Iran later claimed it had targeted U.S. military sites in Bahrain, Kuwait, Oman and Jordan in retaliation for American bombardment, while conflicting statements over whether the Strait of Hormuz remains open added another layer of uncertainty for financial markets.
The stronger U.S. dollar and renewed demand for defensive assets have added pressure across digital assets as investors await further geopolitical developments.
Ethereum continues to defend $1,750 despite losing key moving averages
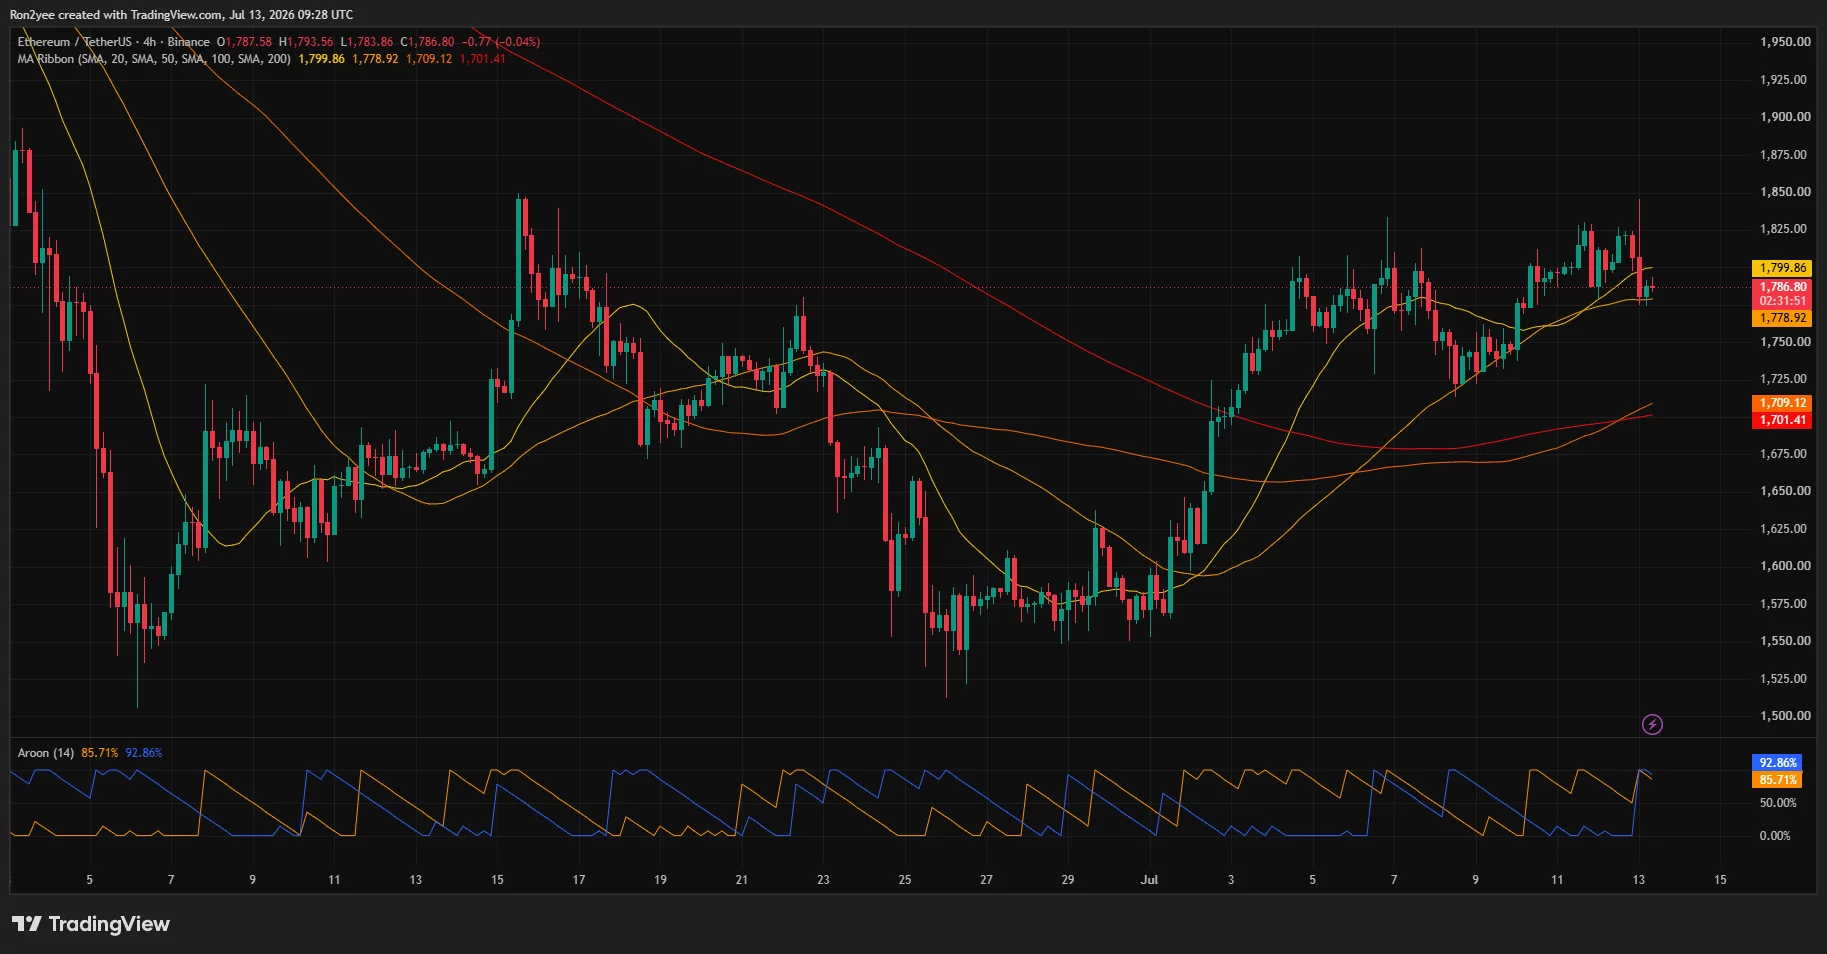
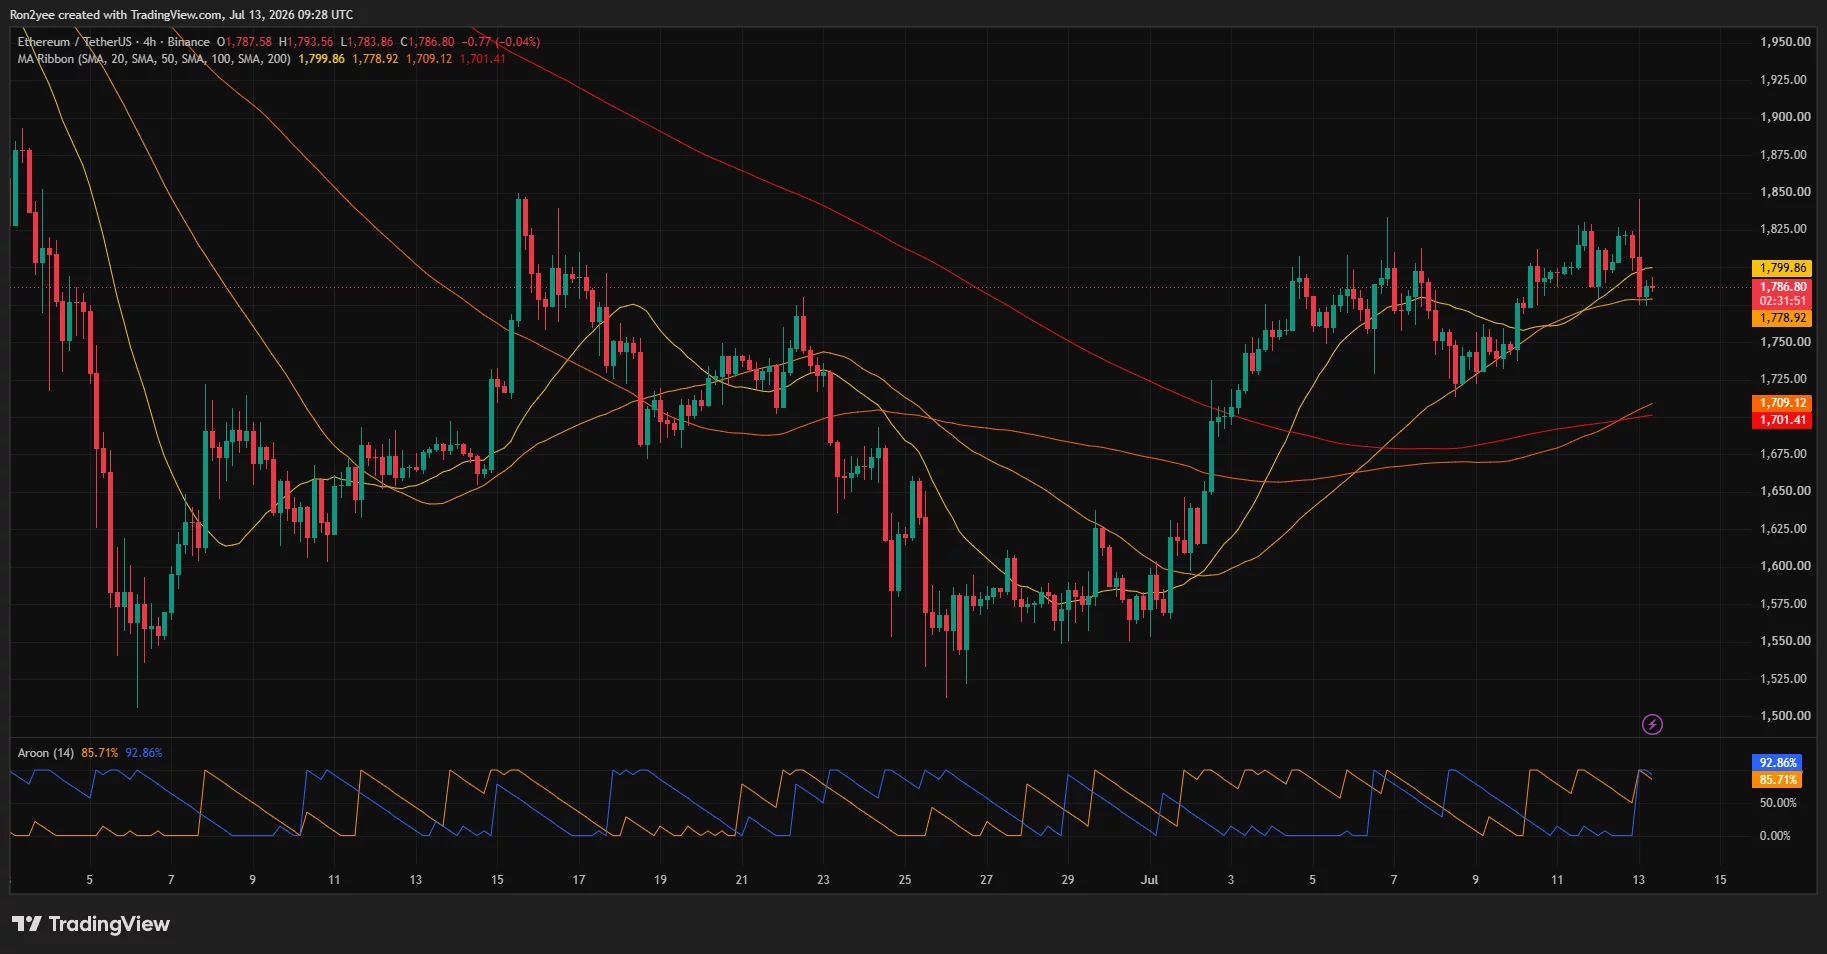
Ethereum’s technical structure has weakened after its price fell below its 20-day moving average near $1,800 on the 4-hour chart. The decline also dragged ETH beneath the psychological $1,800 level that had acted as support throughout last week. Still, the asset continues to trade above its 50-day and 100-day moving averages around $1,779 and $1,709, respectively, preserving the medium-term recovery that began in early July.
The daily chart still shows a potential double-bottom formation with lows near $1,505. A confirmed breakout above resistance around $1,825 would complete that pattern and project an upside target near $2,140.
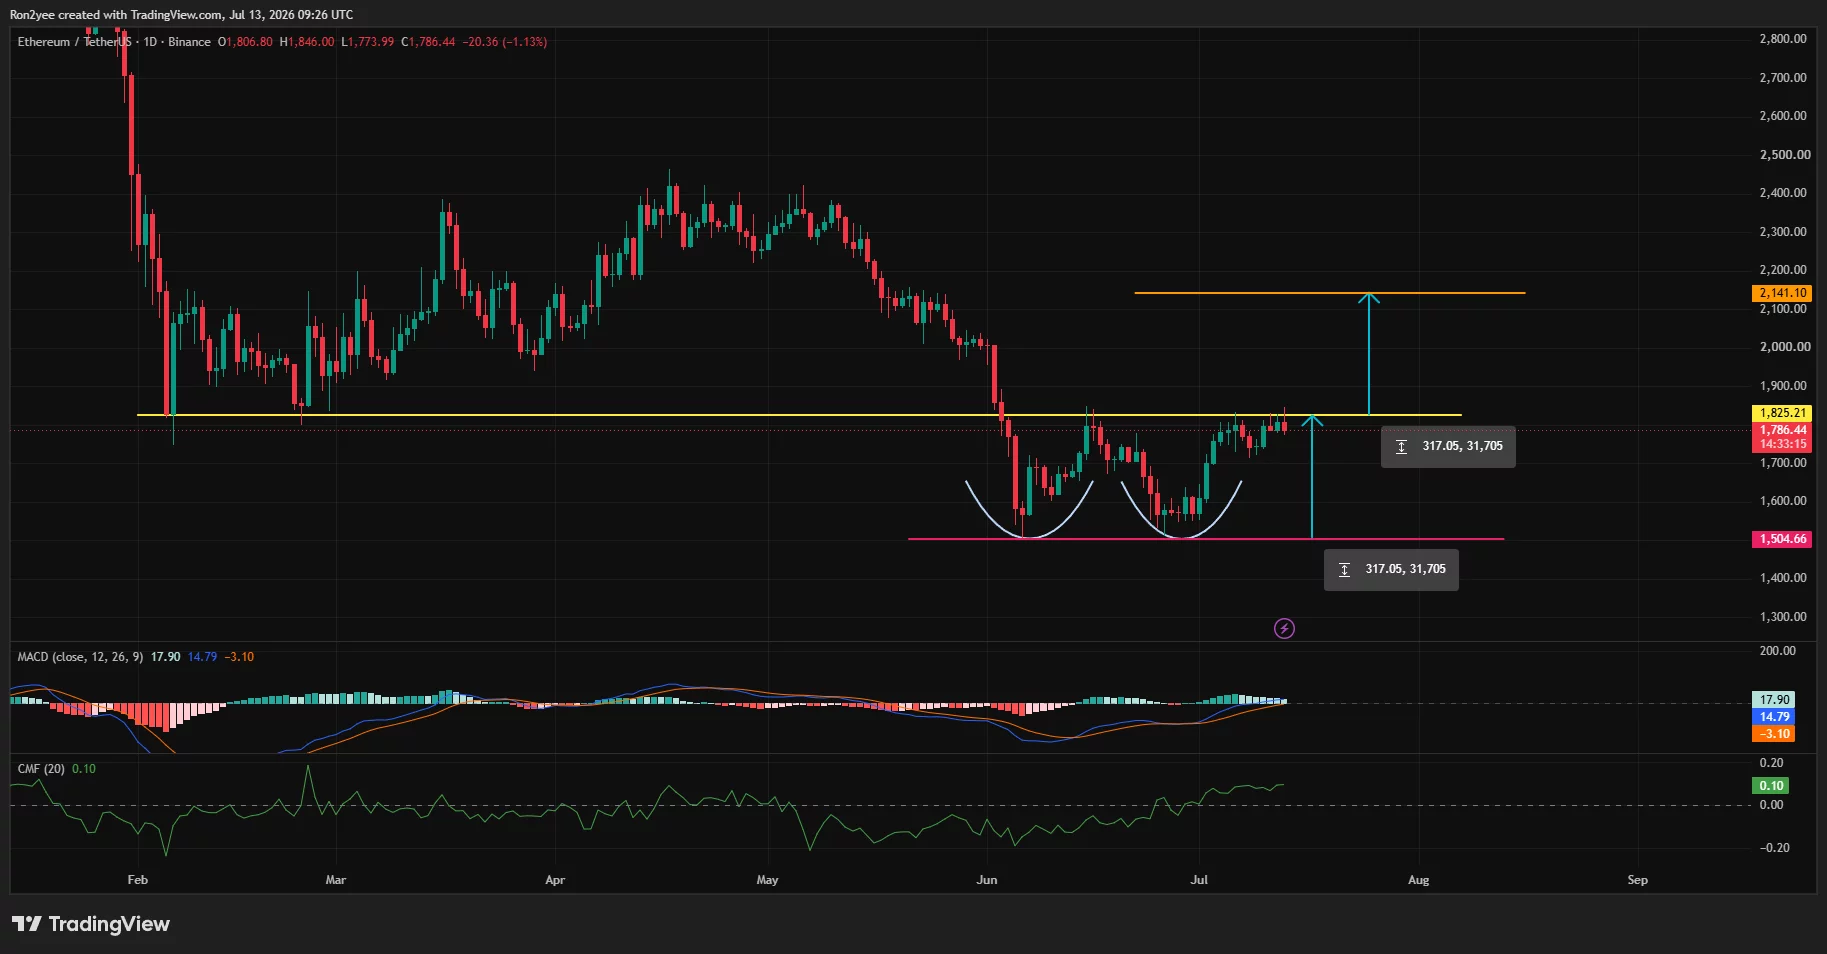
Momentum has yet to fully confirm the move, however. The MACD remains above its signal line despite a narrowing histogram, while Chaikin Money Flow stays in positive territory around 0.10, suggesting capital has not completely exited the market.
The Aroon indicator on the 4-hour timeframe also continues to favor buyers, with Aroon Up near 92.9 and Aroon Down around 85.7. Although both readings remain elevated because of recent volatility, the higher Aroon Up reading suggests bulls still retain a slight advantage if Ethereum reclaims the $1,800-$1,825 resistance zone.
Derivatives positioning presents another important technical level. CoinGlass liquidation data shows one of the largest short liquidation clusters sits between roughly $1,840 and $1,860.
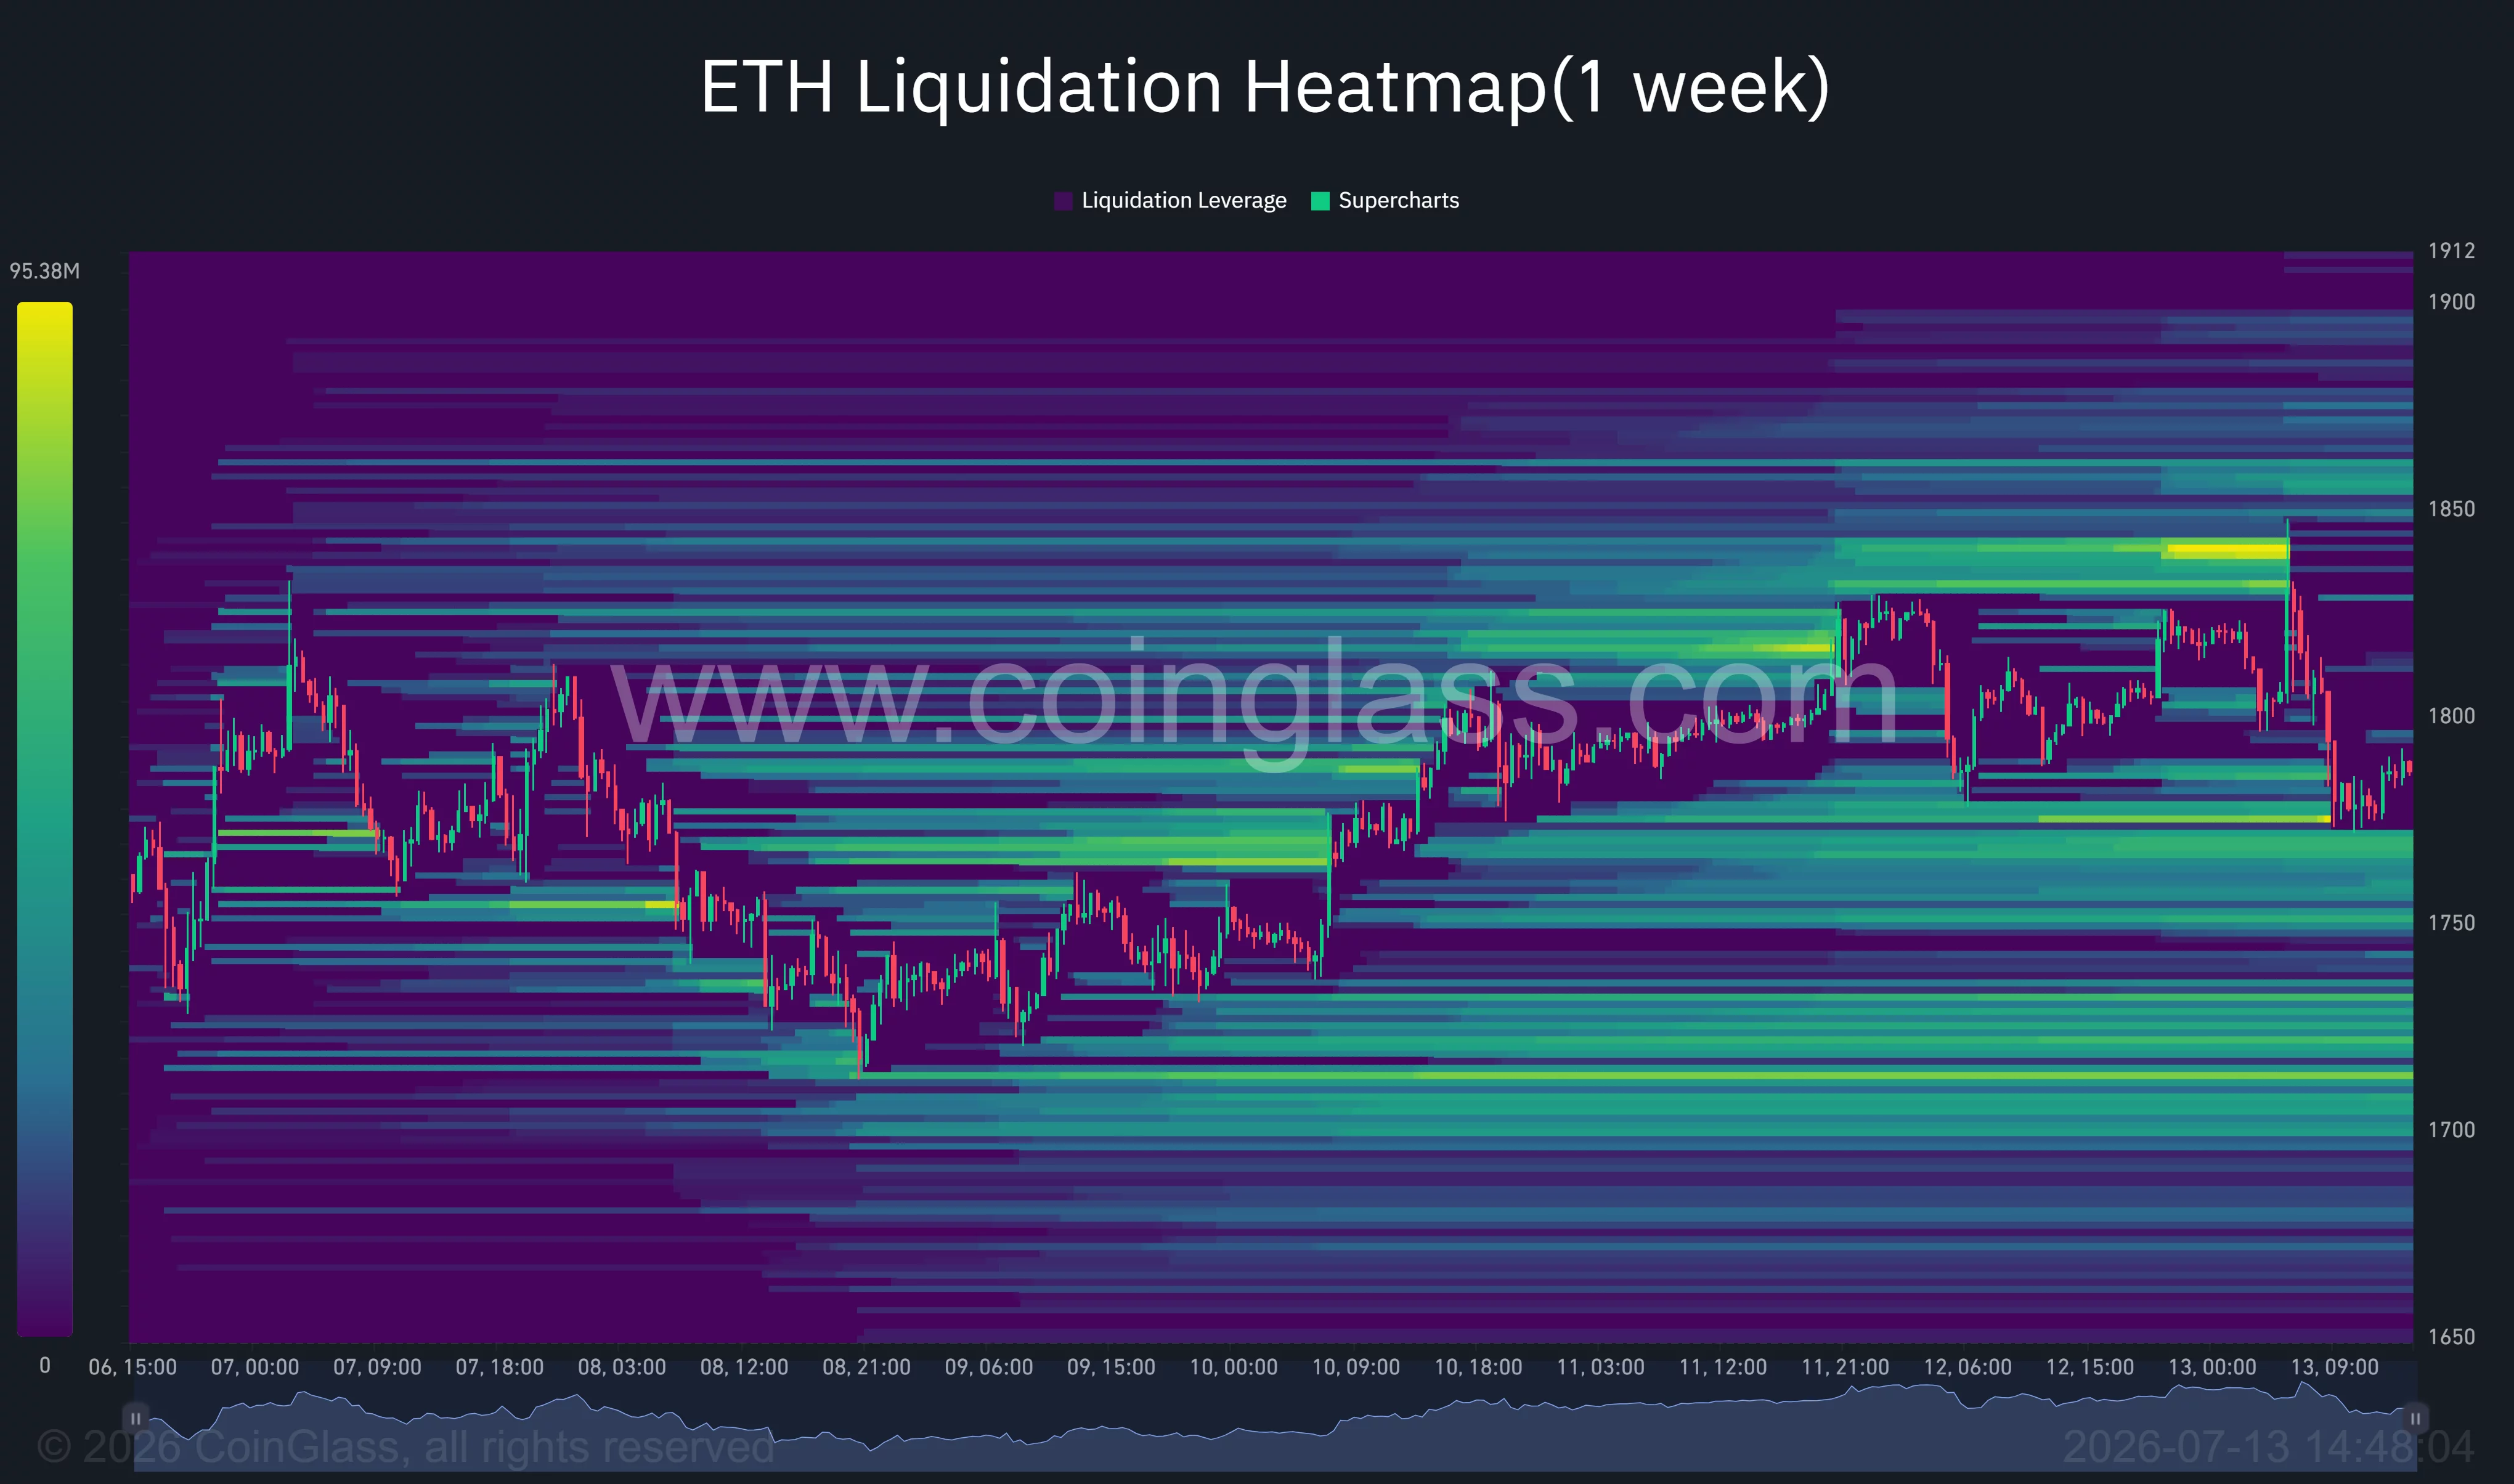
A decisive move through that area could force leveraged short sellers to close positions, potentially accelerating a rally toward $1,900. Larger liquidity pockets remain above $1,900, while notable bid-side liquidity extends toward the $1,700 region.
Commenting on the setup, crypto analyst Ali Martinez wrote, “I’m going LONG on Ethereum $ETH if it breaks $1,850.” His view aligns with the heavy liquidation cluster immediately above current prices, where a breakout could trigger additional buying from short covering.
Failure to hold support could revive the bearish trend
Not every analyst expects an immediate breakout. Analyst Ted Pillows noted in a July 13 X post:
“ETH is still holding above the $1,750 support zone. This is a good sign and shows that sellers are no longer dominating here. As long as Ethereum holds above $1,750, I think a rally towards $2,000 could happen.”
That support now represents the primary invalidation level for the current recovery. A sustained break below $1,750 would place the 100-day moving average near $1,709 back into focus before exposing the June support zone around $1,505, where the double-bottom structure would fail.
Macro risks continue to dominate the outlook. Further escalation between the U.S. and Iran, additional disruption around the Strait of Hormuz, or another surge in crude oil prices could strengthen inflation expectations and reinforce the Federal Reserve’s higher-for-longer interest rate outlook. Under those conditions, cryptocurrencies could remain under pressure even if Ethereum’s longer-term technical structure stays intact.
Disclosure: This article does not represent investment advice. The content and materials featured on this page are for educational purposes only.